🌿 AirWatch — Air Quality Monitoring System
ESP8266 + MQ135 + SSD1306 OLED + Active Buzzer + Web Dashboard
A self-contained air quality monitor that reads CO₂-equivalent gas concentration, displays live AQI on an OLED, fires a buzzer alert at AQI ≥ 110, and streams real-time data to a green-themed web dashboard over Wi-Fi.
📋 Table of Contents
- Overview
- Hardware Requirements
- Wiring
- Software Setup
- Calibration
- Normal Operation
- Web API
- Web Dashboard
- Firmware Reference
- Troubleshooting
- File Structure
1. Overview
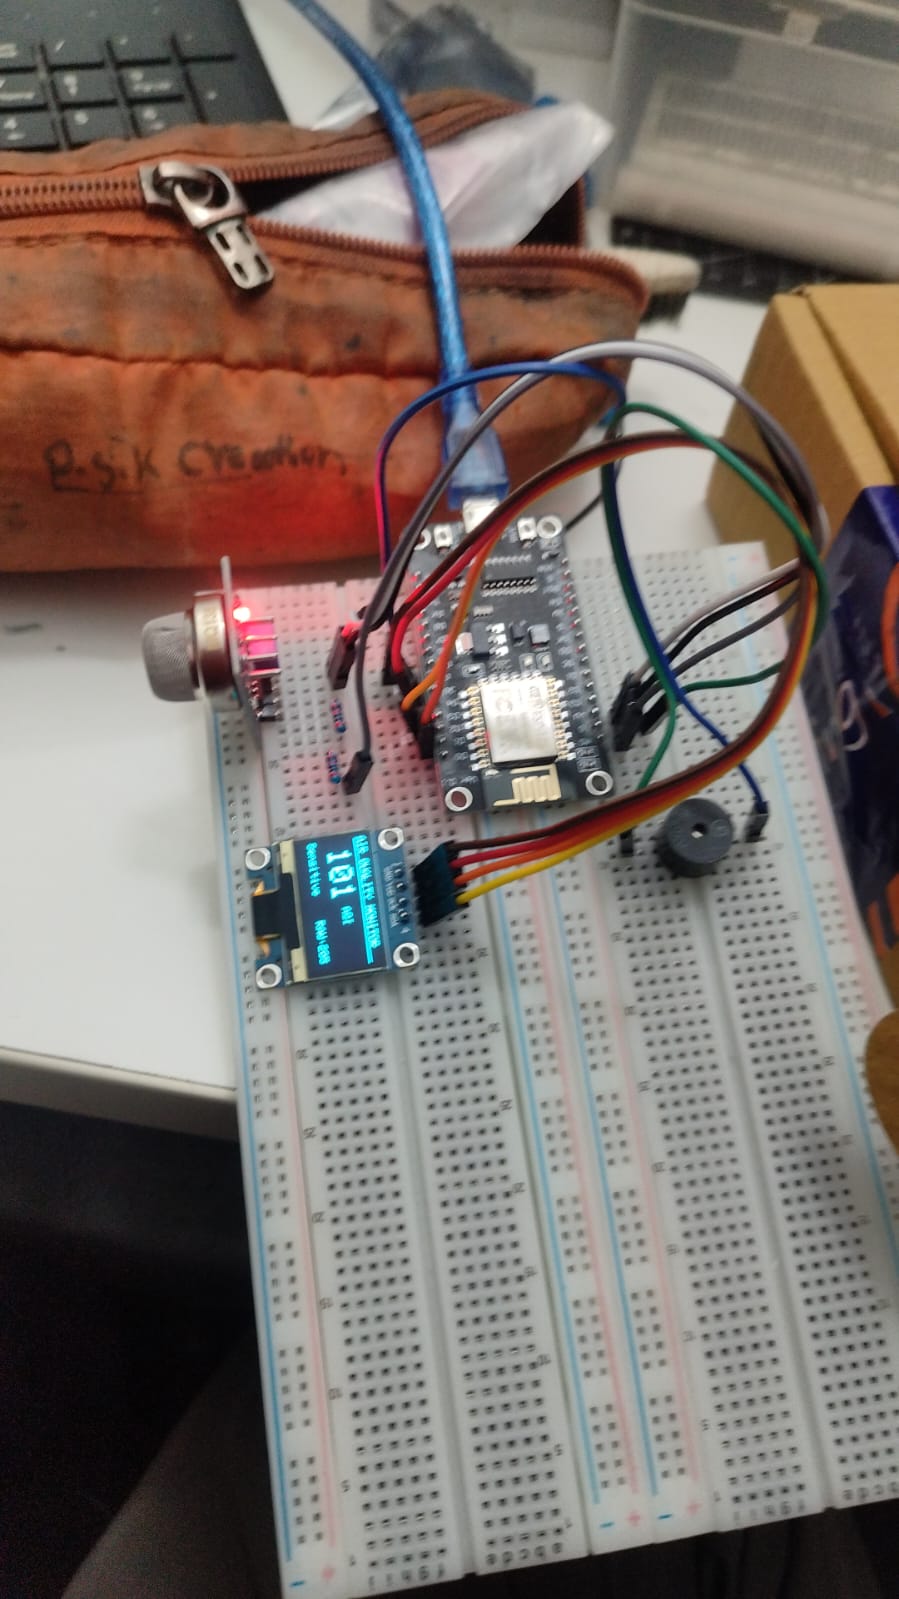
 Project preview
AirWatch reads air quality using an MQ135 sensor every 2 seconds, converts the raw ADC value into a CO₂ PPM estimate, then maps that to a standard AQI index. The result is shown on a 128×64 OLED display and served as JSON over Wi-Fi to a browser dashboard.
When AQI crosses 110 (lower boundary of the Sensitive Groups band), an active buzzer fires a single 300 ms beep. The buzzer re-arms automatically once the AQI drops back below 110, so it will beep again if the threshold is crossed a second time.
Key Features
- Real-time MQ135 sensor reading every 2 seconds
- CO₂ PPM calculation using the MQ135 power-law curve
- PPM → AQI conversion across six standard EPA bands
- Live OLED display: AQI, PPM, category, and alert state
- Single-beep buzzer alert at AQI ≥ 110 (auto re-arms on recovery)
- Wi-Fi HTTP server serving JSON at
GET /data - Green-themed animated web dashboard with ring gauge, history chart, and stats
- Built-in calibration mode for accurate RZERO determination
2. Hardware Requirements
| Component | Details |
|---|---|
| Microcontroller | ESP8266 NodeMCU v1/v2 (or any ESP8266 module) |
| Gas Sensor | MQ135 Air Quality Sensor module |
| Display | SSD1306 0.96″ OLED — 128×64 px — I²C address 0x3C |
| Buzzer | Active buzzer (3.3 V or 5 V with transistor) |
| Resistors | Two 10 kΩ resistors (voltage divider for MQ135 AOUT → A0) |
| Power | 5 V micro-USB to NodeMCU + 5 V to MQ135 VCC |
| Misc | Jumper wires, breadboard or PCB |
3. Wiring
Pin Map
| Component | Pin | ESP8266 Pin | Notes |
|---|---|---|---|
| MQ135 | AOUT | A0 | Via 10 kΩ + 10 kΩ voltage divider |
| MQ135 | VCC | Vin (5 V) | MQ135 heater requires 5 V |
| MQ135 | GND | GND | |
| OLED | SDA | D2 (GPIO4) | I²C data |
| OLED | SCL | D1 (GPIO5) | I²C clock |
| OLED | VCC | 3.3 V | |
| OLED | GND | GND | |
| Buzzer | + | D5 (GPIO14) | Active buzzer: HIGH = ON |
| Buzzer | − | GND |
⚠️ Voltage Divider — Critical for ESP8266
The ESP8266 ADC (A0) accepts a maximum of 1.0 V. The MQ135 AOUT pin can output up to 5 V.
MQ135 AOUT ──┬── 10 kΩ ── A0
│
10 kΩ
│
GND
Connect two 10 kΩ resistors in series between AOUT and GND. Tap A0 from the midpoint. This is already reflected in the firmware as #define VCC 1.0.
4. Software Setup
4.1 Arduino IDE & Board
- Open Arduino IDE → File → Preferences → Additional Board URLs
- Add:
https://arduino.esp8266.com/stable/package_esp8266com_index.json - Tools → Board Manager → search
esp8266→ Install - Select: Tools → Board → NodeMCU 1.0 (ESP-12E Module)
- Set Upload Speed: 115200, Port: your COM/ttyUSB port
4.2 Required Libraries
Install via Sketch → Include Library → Manage Libraries:
| Library | Version |
|---|---|
| Adafruit SSD1306 | Latest |
| Adafruit GFX Library | Latest |
| ArduinoJson | 6.x (not v5 or v7) |
| ESP8266WiFi | Built-in with board package |
| ESP8266WebServer | Built-in with board package |
4.3 Configuration
Edit the top of air_quality_esp8266.ino before uploading:
// Wi-Fi credentials
const char* WIFI_SSID     = "YourNetworkName";
const char* WIFI_PASSWORD = "YourPassword";

// Calibration
#define CALIBRATION_MODE  false   // true = calibration, false = normal run
#define MQ135_RZERO       30.0   // paste your calibrated value here
#define MQ135_RLOAD       10.0   // load resistor on MQ135 board (kΩ)
#define VCC               1.0    // ESP8266 ADC reference (1 V after voltage divider)
5. Calibration
The MQ135_RZERO constant is unique to each sensor and must be measured in clean air. Skipping this step will give inflated PPM and AQI readings.
Step-by-step
- Set
#define CALIBRATION_MODE truein the firmware - Upload to the ESP8266
- Take the sensor outdoors or near an open window
- Open Serial Monitor at 115200 baud
- Wait at least 5 minutes for the heater to stabilise — watch the RZERO column
- Note the value once it stabilises (typically 20–50 with voltage divider)
- Paste it into
#define MQ135_RZERO <your value>, setCALIBRATION_MODE false, re-upload
Expected Serial Output (Calibration Mode)
RAW: 236 | Rs: 6.85 kOhm | RZERO: 28.43  <-- use this after 5 min
RAW: 237 | Rs: 6.81 kOhm | RZERO: 28.27  <-- use this after 5 min
RAW: 235 | Rs: 6.89 kOhm | RZERO: 28.61  <-- use this after 5 min
Tip: Take the average of readings over the last 2 minutes of the warm-up period.
6. Normal Operation
OLED Display Layout
+-----------------------------+
| AIR QUALITY MONITOR         |
|_____________________________|
|  87           AQI           |
|               580 ppm       |
|_____________________________|
| Moderate       RAW: 236     |
+-----------------------------+
When AQI ≥ 110, the bottom line shows !! Sensitive !! instead of the plain category.
Serial Monitor Output
RAW: 236 | PPM: 580.0 | AQI: 87.0  | Moderate
RAW: 241 | PPM: 620.3 | AQI: 95.2  | Moderate
RAW: 255 | PPM: 714.8 | AQI: 104.9 | Sensitive
AQI Bands
| AQI Range | Category | Description |
|---|---|---|
| 0 – 50 | Good | Air quality is satisfactory |
| 51 – 100 | Moderate | Acceptable; some pollutants may be a concern for a small number of sensitive people |
| 101 – 150 | Sensitive | Members of sensitive groups may experience health effects |
| 151 – 200 | Unhealthy | Everyone may begin to experience health effects |
| 201 – 300 | Very Unhealthy | Health alert; everyone may experience more serious effects |
| 301+ | Hazardous | Health warnings of emergency conditions |
Buzzer Behaviour
- Fires one 300 ms beep the moment AQI first reaches or exceeds 110
- Re-arms once AQI drops below 110 — will beep again if threshold is crossed again
- Does not beep continuously while AQI stays above 110
7. Web API
The ESP8266 runs an HTTP server on port 80. Its IP address is printed to both the OLED and Serial Monitor at boot.
Endpoints
| Method | Endpoint | Response |
|---|---|---|
| GET | / | Plain-text status and IP |
| GET | /data | JSON with current readings |
Sample JSON Response
{
  "aqi":      87,
  "ppm":      580,
  "category": "Moderate",
  "alert":    false,
  "ip":       "192.168.1.42"
}
The response includes Access-Control-Allow-Origin: * so any browser tab or local HTML file can fetch it without CORS errors.
8. Web Dashboard
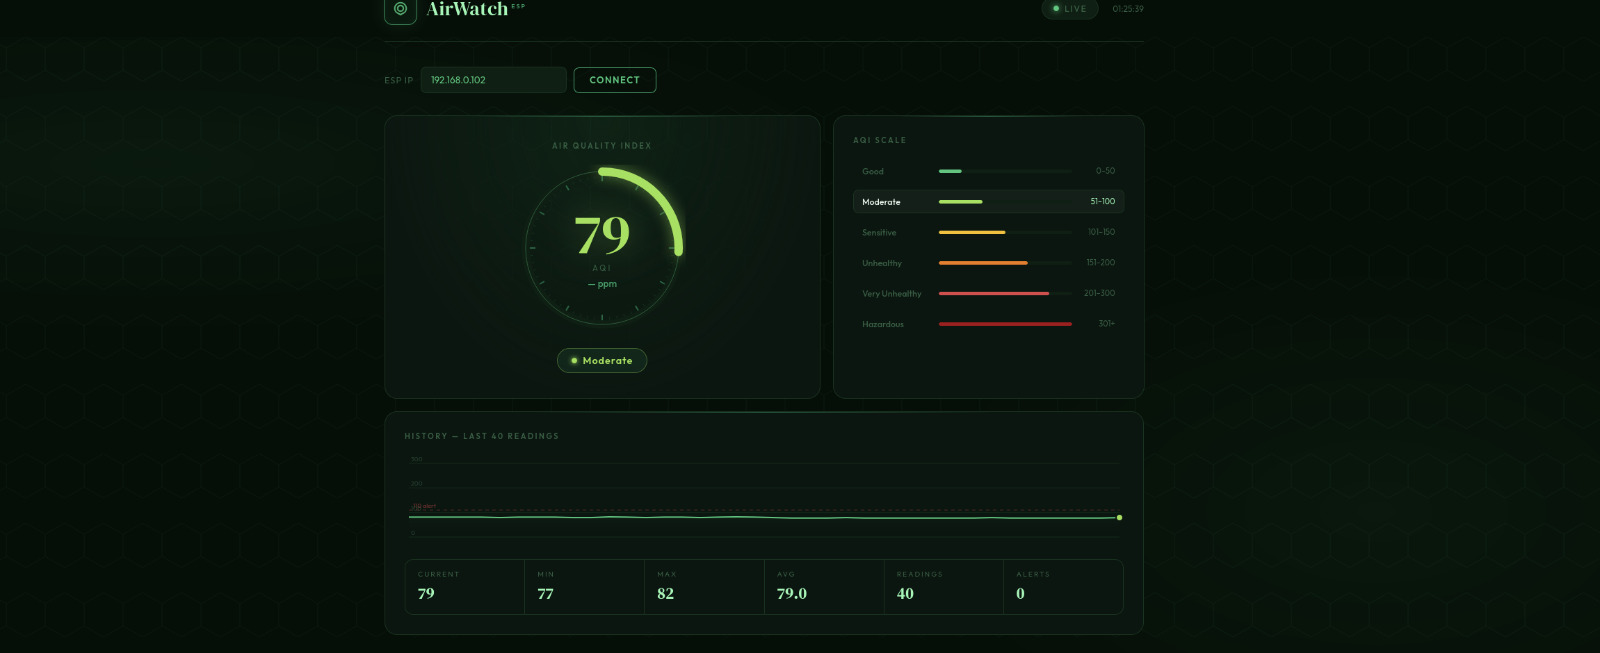
 webdashboard
Open airwatch_dashboard.html in any modern browser. It runs a demo animation automatically before connecting to hardware.
Connecting to Live Hardware
- Find the ESP8266 IP address on the OLED at boot or in Serial Monitor
- Enter the IP into the ESP IP field in the dashboard
- Click Connect — data refreshes every 2.5 seconds
Dashboard Components
| Component | Description |
|---|---|
| Ring Gauge | Animated circular gauge with tick marks; colour changes per AQI band |
| AQI Number | Large number with matching colour glow |
| PPM Reading | Shown inside the gauge below the AQI value |
| Category Badge | Colour-coded pill showing the current band name |
| Alert Banner | Red flashing banner when AQI ≥ 110 |
| AQI Scale | Six colour-coded bands; active band highlights live |
| History Chart | Sparkline of last 40 readings with dashed alert line at 110 |
| Stats Row | Current / Min / Max / Avg / Reading count / Alert count |
9. Firmware Reference
Key Functions
| Function | Description |
|---|---|
rawToPPM(int raw) | Converts ADC value to CO₂-equivalent PPM using MQ135 power-law curve |
ppmToAQI(float ppm) | Maps PPM to AQI across six linear segments |
aqiCategory(float aqi) | Returns string category name for an AQI value |
updateDisplay(int raw) | Redraws OLED with AQI, PPM, category, and alert state |
singleBeep() | Drives BUZZER_PIN HIGH for 300 ms then LOW |
handleData() | HTTP handler — serialises state to JSON with CORS header |
mapf(x, in_min, ...) | Float-precision version of Arduino map() |
Timing
| Event | Interval |
|---|---|
| Sensor read + OLED update | Every 2000 ms |
| Buzzer pulse duration | 300 ms |
| Dashboard fetch interval | Every 2500 ms (client-side) |
PPM Formula
Rs    = ((VCC - Vout) / Vout) × RLOAD
ratio = Rs / RZERO
PPM   = 116.6020682 × ratio^(−2.769034857)
10. Troubleshooting
| Symptom | Fix |
|---|---|
| AQI shows 301 constantly | RZERO needs calibration. Run calibration mode outdoors for 5+ min and update MQ135_RZERO. |
| AQI too high right after power-on | Normal — MQ135 heater needs 2–5 min warm-up. Wait before trusting readings. |
| OLED shows nothing | Check SDA→D2 and SCL→D1. Verify I²C address is 0x3C. Some clones use 0x3D. |
| Wi-Fi never connects | Check WIFI_SSID / WIFI_PASSWORD. ESP8266 only supports 2.4 GHz networks. |
| Dashboard shows OFFLINE | Confirm the IP is cor |